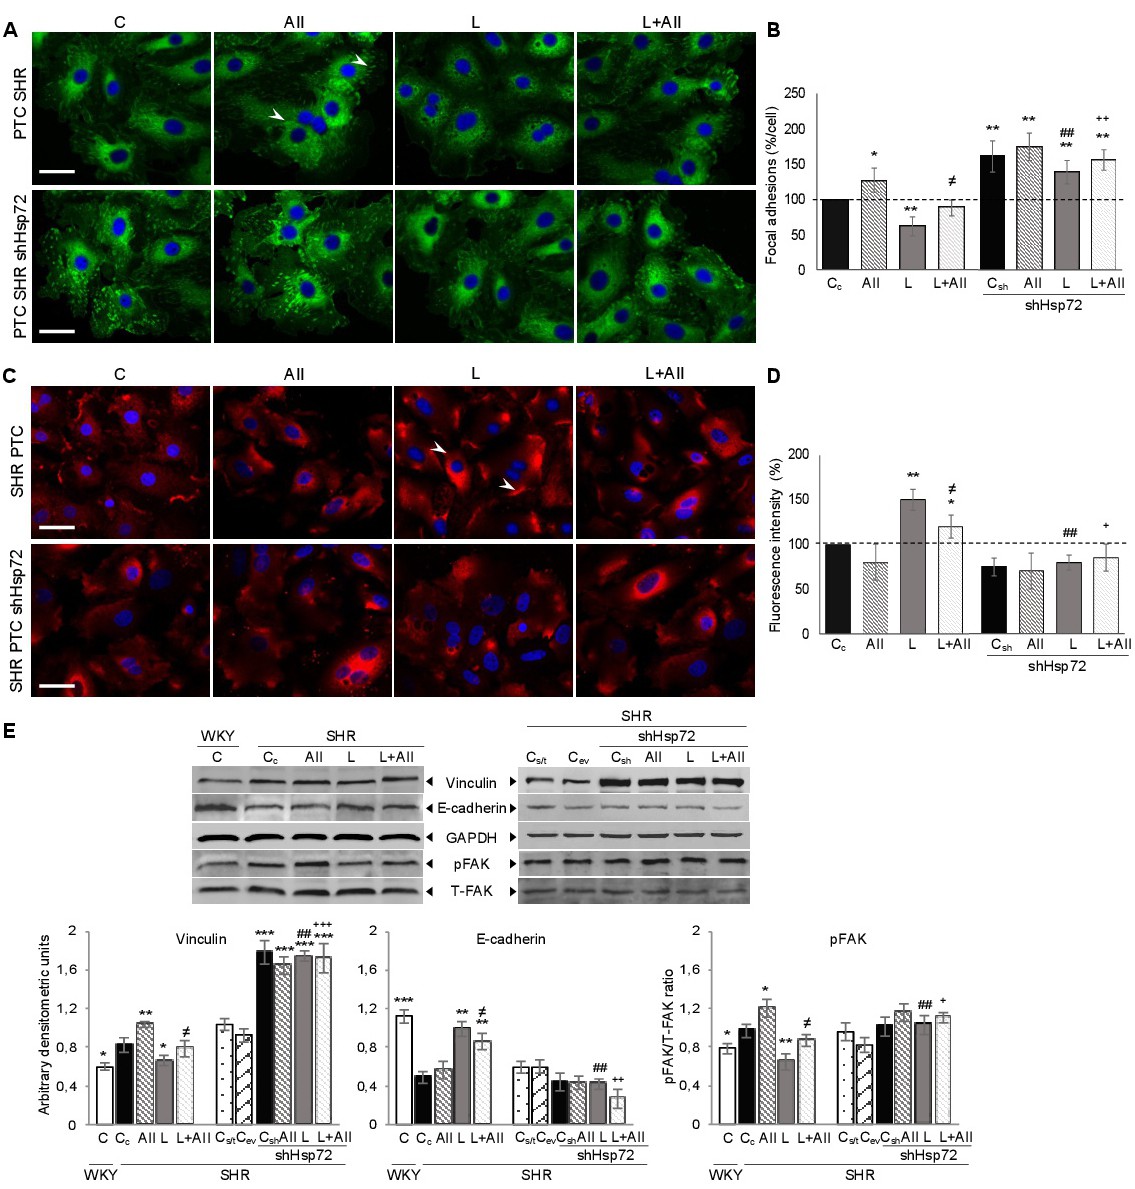
Fig. 2. Hsp70 involvement in the Losartan effect on focal adhesions and junction cell stabilization. SHR PTCs or shHsp72 Knockdown SHR PTCs were subjected to different treatments: Control (Cc or Csh), Angiotensin II (AII), Losartan (L) or Losartan plus Angiotensin II (L+AII). To visualize focal adhesions and analyze the distribution of intercellular adhesion molecule E-cadherin, the cells were stained with anti-vinculin and with anti-E-cadherin respectively and analyzed by immunofluorescence. A) Fluorescence micrographs show focal adhesions (white arrowheads) of SHR PTCs (upper panel) or shHsp72 knockdown SHR PTCs (lower panel). B) Quantification percentage of focal adhesions per cell. C) Fluorescence micrographs show the distribution of E-cadherin (white arrowheads) in SHR PTCs (upper panel) or shHsp72 knockdown SHR PTCs (lower panel). D) Quantification of the fluorescence intensity on the cell periphery. Pictures display representative areas of staining from 3 independent experiments. Bar: 50 μm. The data are expressed as a percentage relative to the SHR PTCs control (defined as 100%). At least 70 cells were analyzed for each treatment in three independent experiments. E) Immunoblot analysis of Vinculin, E-cadherin, pFAK and T-FAK in total fractions from SHR PTCs, shHsp72 Knockdown SHR PTCs subjected to different treatments and SHR PTCs empty vector transfected (Cev) or non-transfected (Cs/t). GAPDH was used as loading control. Band intensities were quantified by densitometric analysis. The phosphorylation of FAK was normalized to total protein expression. Bars means ± SEM, n=3. *p≤0.05; **p≤0.01; ***p≤0.001 vs SHR PTCs control group (Cc). ##p≤0.01 vs SHR PTCs (L). ≠ p≤0.05 vs SHR PTCs (AII). + p≤0.05; ++ p≤0.01; +++ p≤0.001 vs SHR PTCs (L+AII).